Story mapping
Story mapping arranges a product’s stories in two dimensions: the user’s journey along the top, and the stories that realise each step hanging underneath, ordered by necessity. Horizontal slices then become releases.
It was created by Jeff Patton, who named the thing it fixes: a flat backlog sorted by priority loses the one piece of information that tells you whether a release is worth shipping — the shape of the journey it belongs to.
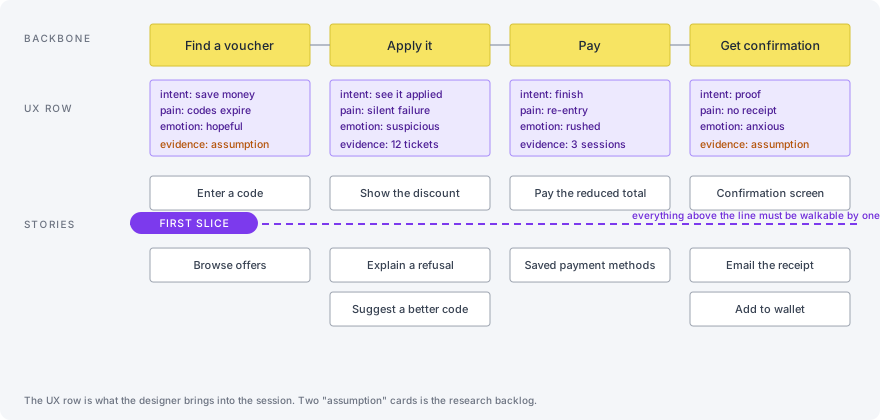
Story mapping was created by Jeff Patton and set out in User Story Mapping (O’Reilly, 2014). The UX row is the addition this hub makes to it.
The map, in three parts
Section titled “The map, in three parts”The backbone. The journey’s steps, left to right, in the order a person does them. This is a narrative, and it should read as one out loud: finds the thing, compares it, decides, pays, gets confirmation, tracks it, returns it.
The body. Under each step, the stories that make it work, ordered top to bottom by how necessary they are.
The slices. Horizontal cuts through the whole map. The first cut is the thinnest thing a person can actually get through, end to end.
Why the designer is in this room
Section titled “Why the designer is in this room”Because the backbone is the journey, and the journey came out of journey mapping — a session the designer ran. Building the backbone without them means reconstructing it from memory, and what gets reconstructed is always the happy path: the steps people remember are the ones that worked.
There is a second reason, and it is the one that changes the output. Slicing is the highest-leverage decision in the session, and a slice is only shippable if it is usable. Deciding that is a design judgement. A team without a designer in the room will slice by what is buildable, produce a technically complete release that nobody can operate, and discover the gap after it ships.
What the contracts contribute
Section titled “What the contracts contribute”The design system and the core component library come into this session as inputs. Not as documents on the table — as knowledge in the room, held by the designer and the developer.
They change one thing, and it is the thing story mapping is worst at without them: an estimate of what a slice actually costs.
A card that reads “filter the results” is a day if the library has a filter pattern and a fortnight if it does not. Both look identical on a wall. A room that cannot tell them apart slices by hope, and the release that comes out is the one where the last two cards were quietly much larger than the first six.
So the useful question at slicing time is not only is this walkable but what does this slice need that does not exist yet. That second question has an answer only when the library is established, and it is what turns a story map from a wishlist into a plan.
The UX row
Section titled “The UX row”The addition this hub makes to the standard practice: a row directly under the backbone, above the stories, holding what is true about the person at this step rather than about the software.
Per backbone step, four cards:
| Card | Holds | Why it belongs on the map |
|---|---|---|
| Intent | What the person is trying to do here, in their words | Keeps the story titles honest; a story that serves no intent is a feature looking for a user |
| Pain | What goes wrong for them here today, and how badly | Sets the investment per step — most steps deserve almost nothing |
| Emotion | Confident, rushed, anxious, distracted | Decides density, confirmation and tone; the anxious step is where you add a confirmation and the rushed step is where you remove one |
| Evidence | How you know — a session, a ticket, a metric, or “assumption” | The most valuable card, because it makes the assumptions visible as assumptions |
The Evidence card is the one to add first if you only add one. A map whose UX row says assumption five times across seven steps is telling you something important before a single story is estimated.
Slicing with the UX row present
Section titled “Slicing with the UX row present”The rule: a slice must be walkable. Take the cut, read the backbone left to right, and tell the story of one person getting through it using only the cards above the line. If the telling requires “and then they would just…”, it is not a slice.
Four failures this catches, all of them common and all of them expensive to discover later:
- The functional non-journey. Every capability exists, in no order a person can follow. Usually produced by slicing along technical layers.
- The dead end. The slice gets someone to a state with no way forward and no way back — an order placed with no confirmation, a form submitted with no receipt.
- The unattended failure. The happy path is sliced in; what happens when it fails is scheduled for later. In practice “later” is after the first user hits it.
- The invisible invention. The slice looks thin and needs two components the core library does not have. It is not thin, and it will be discovered in the third week rather than in the session.
What comes out, and where it goes
Section titled “What comes out, and where it goes”| Output | Goes to |
|---|---|
| The backbone | The names of the journey tests — one per backbone traversal |
| The stories in the first slice | Example mapping, one story at a time |
| The UX row’s Pain and Emotion cards | Which established patterns the story should reach for — a confirmation at the anxious step, fewer at the rushed one |
| The UX row’s Evidence gaps | The research backlog, and the first candidates for a usability session |
| Anything the library does not cover | A change request against an established contract, raised now rather than during the sprint |
Not example mapping
Section titled “Not example mapping”Different axis, different session. Story mapping works across the whole journey and decides which stories exist and in what order; example mapping works on one story and decides what it means. The map picks the next card to open; example mapping opens it.
Running it
Section titled “Running it”Two to three hours for a first map, with everyone: the product owner, the designer, a developer, a quality engineer, and a domain expert when the domain is where the doubt is. Then twenty minutes a week to keep it true, which is the part teams skip and the reason most maps are photographed once and never opened again.
Keep it on a wall or a shared canvas while it is being argued about. It becomes a digital artefact only when it stops changing hourly — before that, the tool tax is paid for a map that will be wrong by Thursday.